- cross-posted to:
- python@programming.dev
- cross-posted to:
- python@programming.dev
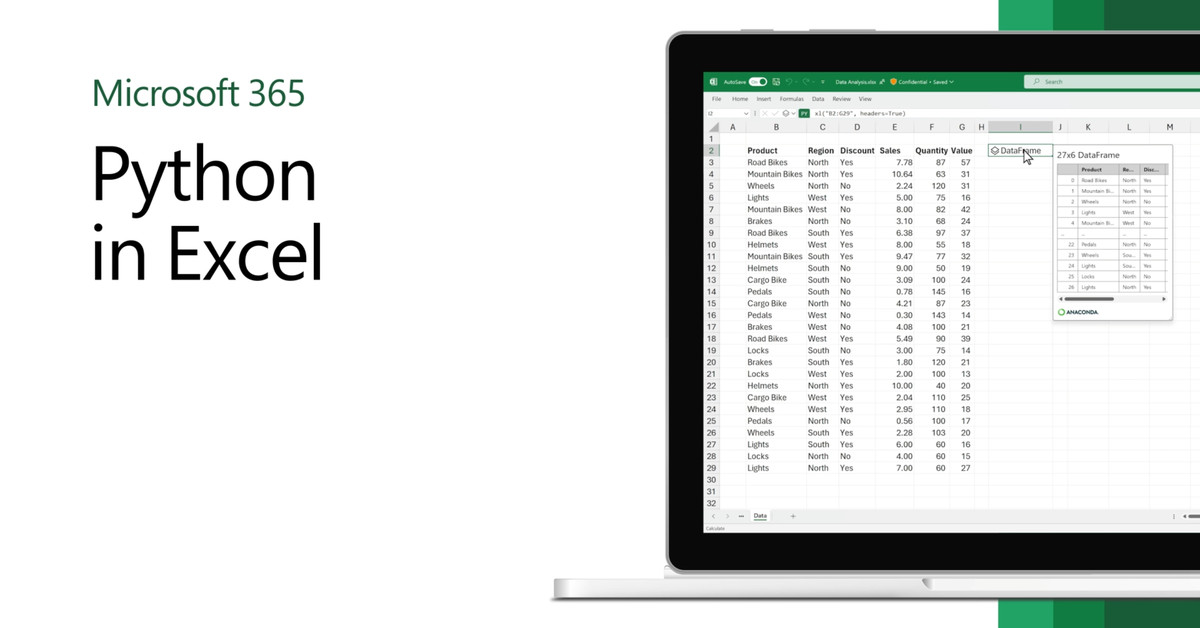
Microsoft is bringing popular programming language Python to Excel. A public preview of the feature is available today, allowing Excel users to manipulate and analyze data from Python.
You won’t need to install any additional software or set up an add-on to access the functionality, as Python integration in Excel will be part of Excel’s built-in connectors and Power Query. Microsoft is also adding a new PY function that allows Python data to be exposed within the grid of an Excel spreadsheet. Through a partnership with Anaconda, an enterprise Python repository, popular Python libraries like pandas, statsmodels, and Matplotlib will be available in Excel.


Finally. Another step to automate my work.
Excel formulas are way too limited and VBA is a nightmare to work with.
Will this actually automate your workflow?
It seems that this Python integration expects that the source data already exists within the Excel file and Python can essentially just be used to create either visuals or new tables within the same Excel file.
If that’s accurate, then this is intended exclusively for data analysis and not process automation. I don’t think this will allow people to enhance their existing Python based ETL jobs or create new ones because of this new integration. This does not seem to be a replacement/substitute for VBA or OfficeScripts. It also does not seem to be an alternative to Power Query. If anything, this seems to be most similar to Power Pivot.